Stop Guessing Your Tonnage: Real Solutions for Stockpile Inventory
Let’s be honest: manually measuring stockpiles is a grind. Surveyors know all too well the reality of climbing over dozens of loose aggregate piles with a GPS rover, trying to estimate the toe of a pile while dodging active loaders. When volumes are updated only at month-end or quarter-end, the process is usually rushed, and the numbers are often just educated guesses.
Common patterns across the industry look like this:
- Eyeball estimates taken from the pit floor or a loader cab.
- Infrequent total station or GPS surveys a few times a year.
- Pen-and-paper tallies tracked in siloed spreadsheets.
The problem isn't the effort; it’s the method. Inaccessible faces and toes are skipped for safety, so the hardest-to-measure parts are often guessed. Voids near walls and between stockpiles stay hidden, and angle-of-repose assumptions ignore how piles actually slump and compact. By the time anyone updates the numbers, seasonal weather like spring melt or heavy rain may have already reshaped the pile into its third form of the season.
The AI Advantage is About Time, Not Magic
There is a lot of buzz about Artificial Intelligence being a silver bullet for mining operations. Let's ground that in reality. AI is not magic; it is simply a highly efficient tool designed to do the tedious work so your engineering and survey teams do not have to.
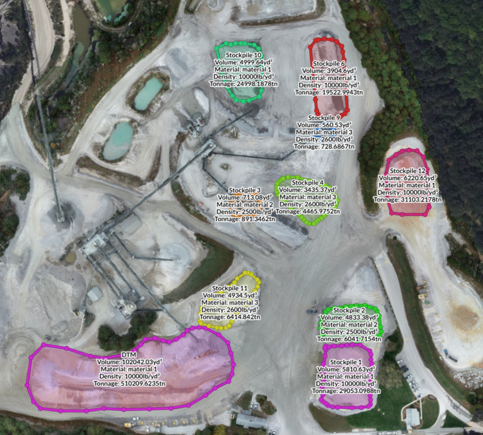
Think about the time it takes to manually walk and calculate volumes for a site with 20, 50, or 100 piles. Survey cycles can take weeks or months. When you process dataset imagery and toggle on "Stockpile AI," the system will auto detect the stockpile toe and boundary for you. Instead of surveyors putting themselves at risk on unstable faces, drones capture the entire site from above, dropping survey cycles from weeks to just days.
This technology is designed to solve real technical pitfalls. When a pile is sitting on a slope or a hillside, traditional measuring struggles. With algorithmic volumetrics, you can apply a Triangulated Fit—a complex surface made of a set of triangular faces created between boundary points—or a Linear Fit to accurately calculate the base without manually interpolating the grade.
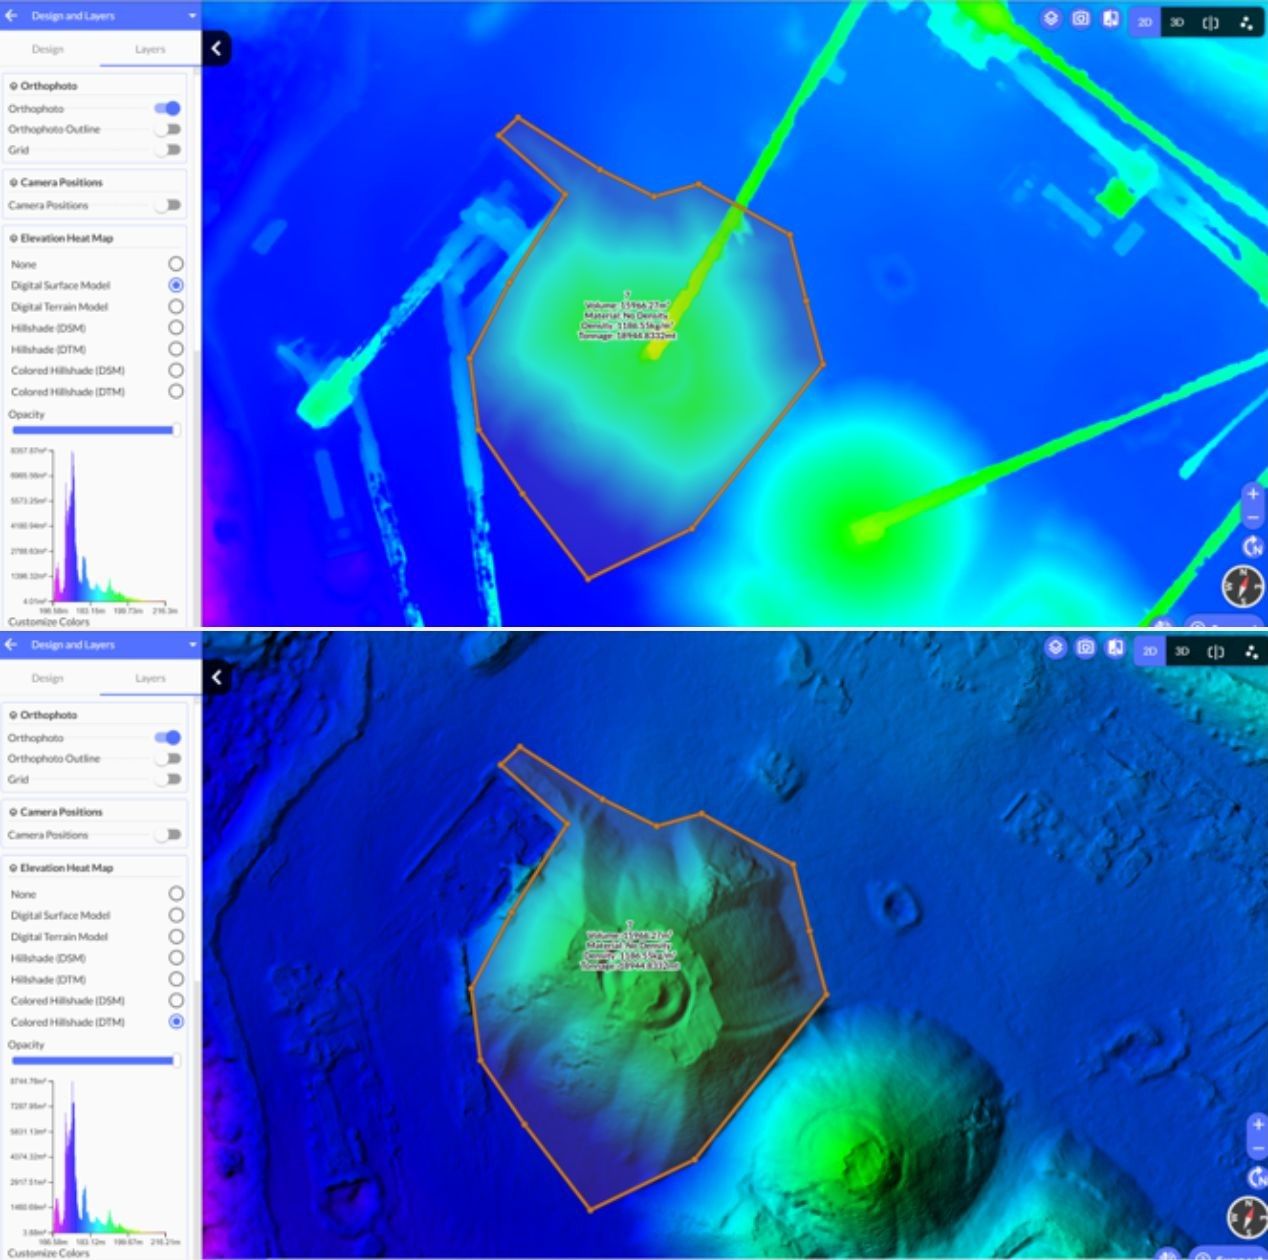
Is there a massive vertical stacker parked right over your aggregate? You do not need to guess how much volume it is displacing. By switching the view from a Digital Surface Model (DSM) to a Digital Terrain Model (DTM), the software can automatically filter buildings, trees, vegetation, and equipment directly out of the volumetric calculation.
Uncovering the Hidden Tonnage
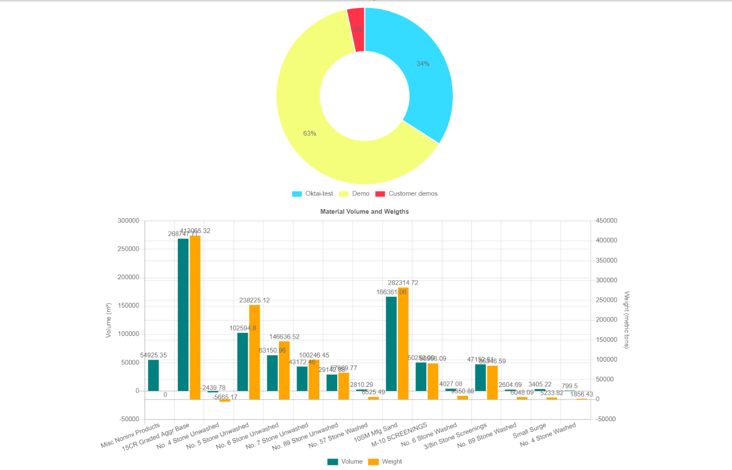
Stockpile blind spots are all the places where what you think you have does not match what is really there. Invisible volume loss creeps in through unrecorded truck loads, wind erosion, washing during storms, and rehandling spillage that no one tracks in real time. These blind spots erode profit through lost tons, rushed purchases, and stop-and-start production. When feed from the stockpile is not what the plant expects, you get inconsistent throughput and off-target crusher settings. By utilizing drone photogrammetry and automated visual intelligence, the entire site becomes a living digital twin that can be compared flight to flight. You can track the history of individual piles via an inventory dashboard, viewing exact changes in volume, tonnage, and monetary value over time. You can even input specific material data like SKU, density, and price per ton and push that verified stockpile data directly to ERP systems like SAP via API integration.
Accurate stockpile data is not just about neat reports; it reshapes how a site plans from pit to plant. It allows operations to align extraction schedules with real downstream demand and hit throughput targets with fewer surprises and less trial and error. When we can see stockpiles clearly with AI-powered visual intelligence, those unknowns turn into hard numbers that everyone can plan around.
Q&A
Q: Why are traditional manual stockpile surveys often inaccurate?
A: Manual surveys rely heavily on angle-of-repose assumptions that ignore how piles actually slump and compact. Furthermore, inaccessible faces and toes are frequently skipped due to safety hazards, meaning the hardest-to-measure parts of the pile are often just guessed.
Q: Where does "hidden" tonnage go between inventory checks?
A: Invisible volume loss typically creeps in through wind erosion, washing during storms, unrecorded partial truck loads, and rehandling spillage that no one tracks in real time. Moisture changes can also shrink or swell material, throwing off density assumptions.
Q: How does drone surveying actually save time if I have a site with 100 piles?
A: Traditional methods require a surveyor to physically walk the toe of every pile, which means survey cycles can take weeks or even months. Drones capture the entire site from above in a single flight, allowing AI to automatically detect boundaries and calculate volumes, dropping the survey cycle to just days.
Q: Does this data actually improve plant production?
A: Yes. When feed from the stockpile is not what the plant expects, you get inconsistent throughput and off-target crusher settings. Accurate, real-time stockpile data allows operations to control feed size and hardness, hit throughput targets, and smooth out seasonal peaks.
YouTube Video Link: https://youtu.be/IEWlwS3-07s?si=OzZzG-YRyrfH0vnI
#EngineeringDocs #StockpileAI #DroneVolumetrics #APIIntegration #InventoryManagement