Cracking Ore Deposit Prediction
Our journey using Deep Learning to build an AI model capable of predicting ore deposits from satellite imagery and remote sensing data.
“When democracy defeated prejudice we decided to take advantage of this fact and return to the old and proven methods - to black magic. In the newest world, we can finally not be afraid of persecution for using magic in order to achieve benefits.
It is not for nothing that circles (spheres) are used in the Strayos logo - as spheres are the iconic tool of black magic, allowing you to look into the past, future, and parallel worlds simultaneously.
Today we will consider two cases where we use several of black magic's tricks in the examples of determining mineral deposits - knowledge, faith, and deep learning.” Oktai Radzhabov, Strayos
In the development of our Deep Learning AI model to detect mineral deposits we participated in two crowd sourced mining challenges- The Explore SA Gawler challenge and the Copa De Cobre Peru challenge. Both challenges gave us access to valuable data and resources allowing us to develop and refine several Deep Learning models and both challenges presented with unique challenges and opportunities.
Our First Model- The Explore SA Gawler Challenge
The goal of the Explore SA challenge was to identify or predict mineralization locations in the Gawler Craton area of South Australia. This challenge provided a wide variety of input data, such as Gravity, TMI, drilling, and geochemical data. Each data set was presented in a different structure and format, such as raster, vector, tables, images, reports and so on requiring a method of incorporating and reconciling the different formats into one model.
At first, we tried to figure out the usability for each of the datasets. This was a particular challenge for us as we weren’t familiar with several of the data sets and we quickly got lost. We decided to simplify the task for our first build and used the most representative datasets to train the simple model.
By the end, we were using a hybrid data-driven and knowledge-driven approach to do our mineral prospectivity mapping. Specifically, we applied a deep learning Convolutional Neural Network(CNN), which utilizes known mineralization locations to recognize signatures of a surrounding neighborhood of data, to train and validate the model. The work is focused on discovering the IOCG related (Copper, Gold, Uranium, Iron) and Lead mineralization deposits.
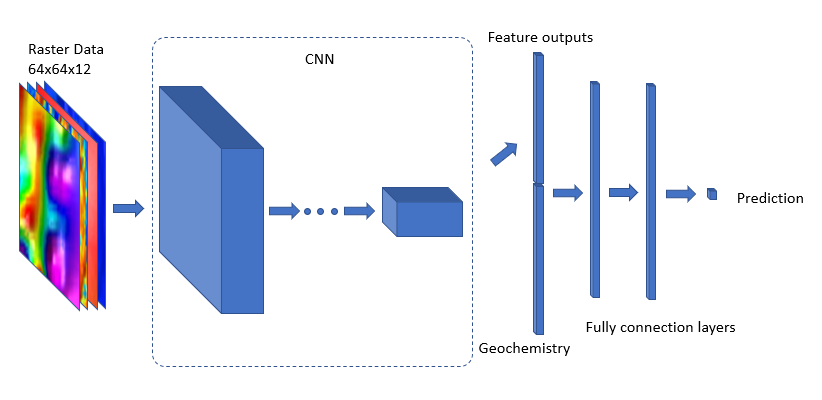
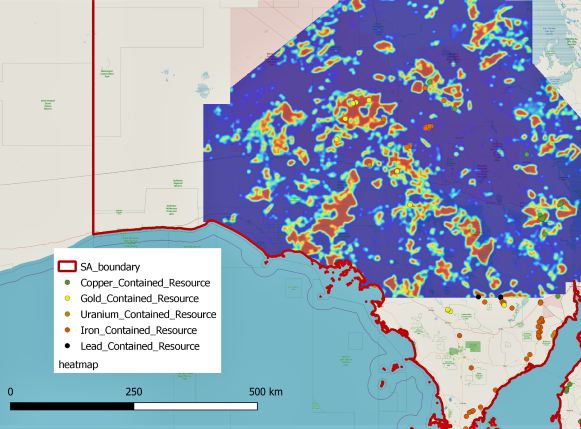
Four geophysical predictor features, Gravity, TMI, Gravity 1VD and TMI VRTP 1VD, and 92 different geochemical abundance datasets were used as the input for the model. The raster data was extracted into patches so that we could use CNN to explore the spatial relation of the deposit location and its surrounding areas. The geochemical data was cleaned and simplified and fed into the machine learning model. Together, they generated a probability range of 0 to 1. This range was used to generate a heatmap of potential mineralization locations for the Gawler Craton area. The heat map highlights regions more likely to bear the targets of Copper, Gold, Iron, Lead and Uranium mineral formations.
Part 2- The Copa de Cobre Challenge
The Copa de Cobre challenge presented us with a completely different set of hurdles while trying to obtain the same result. We were required to adapt our model to a significantly different set of data inputs- essentially much less information. At first this was viewed as a significant challenge and was very exasperating, we knew we needed lots and high quality data to build and train the best model. How could we do our job with what was provided? However, we soon realized it presented us with a real opportunity. In the real world data sets will not always be abundant and high quality. Necessity is the mother of invention! We accepted the challenge and improvised.
We needed to generate a mineral map of Peru. But compared to the abundance of datasets in Explore SA challenge, the data provided was quite limited. Additionally, there were no metrics to evaluate the quality of a particular approach. The organizers declared that the winners would be decided by productivity, informativity and usability of the provided approaches rather than a deterministic procedure. These different selection criteria allowed us to extend the possible approaches we used. We were able to define our own objectives for the model.
The only data we were provided were Multispectral Sentinel 2 mosaics of Peru, but thanks to the Unearthed Community, we were able to find useful suggestions and data sources to help us (“Mineral Resources Data System” MRDS ). Considering the parameters of this new challenge and our previous experience (and struggles) with the Explore SA challenge, we knew we would have to do a lot of research about mineral mapping using satellite imagery in order to gain more knowledge.
So we researched. A lot.
And then we refined our approach ultimately utilizing our previous model and developing a completely new one.
If at First You Don't Succeed...
The first approach we came up with was spectral unmixing based. Spectral Unmixing is the process of matching the product of spectral decomposition and known predefined templates. With help of the USGS library we mapped the multispectral Sentinel-2 input mosaics to the Copper ore spectra.
Applying the Copper ore spectra to our spectrum unmixing algorithm (we’ve implemented "Mixture Tuned Matched Filtering" MTMF) allowed our model to generate a probability map of Copper ore distribution over Peru. This approach, however, was limited. It’s pixel-based, which doesn’t incorporate spatial information.
We developed a second CNN model to address the spatial information limitation. We used Multispectral Sentinel-2 patches of Peru around proven deposits (collected from MRDS). We used these as input data for training the neural network to classify metals from the list: 'CU', 'AG', 'PB', 'ZN'.
Try Try Again.
For this second model we used a neural network architecture. We felt this architecture was the best and most effective method for identifying deep relations in the spatial content of the source data and subsequent classifications.
In order to get stronger results from the second model we chose not to make any assumptions about un-labeled data. Instead, we chose to restrict the model to predict conditional probability instead of total probability. So, we developed an approach that allows for the prediction of the metals 'CU', 'AG', 'PB', 'ZN' by multispectral Sentinel-2 patch on one condition – proven presence of at least one metal from the list.

This image represents the model's ability to predict the distribution of the 'CU' metal. Labels from the training sample are shown with blue text. The white-red circles represent the probability of the presence of 'CU' metal.
The second model was parameterized allowing us to tune for various hyper parameters and extend the list of predicted deposits, switch the target area from Peru to any other area with multispectral Sentinel-2 data.
Finding ore deposits has traditionally required either an investment of years or luck.
Now, with the amount of data available to us and the ability of AI to sift through those mountains of data to identify patterns and make predictions, it can be done in a fraction of the time. Creating the model takes just a few months, if not weeks. Once the model is complete, feeding the site data to it and generating a result takes no time.
We were given a fantastic opportunity to explore the potential applications of AI to physical world data and we can’t wait for the next data set to put our models to work.
![]()
Check out our 2 Free E-books on AI applications for the drilling, blasting, and mining industries to see all the amazing advances that are available.
AI Guide for Drilling and Blasting
AI Guide for Mining
TLDR? Watch our videos instead:
YouTube